Using Sampler
Sampler (CF download) is a mod aimed at investigating performance related issues. This page describes how to use it systematically to resolve typical problems.
Identifying the problem[edit]
The first step is the rough categorization in client side, server side and low memory issues.
Low memory[edit]
The Java virtual machine (JVM) manages memory for the application (=Minecraft) through a garbage collector (GC). As the application requests memory for its operation/data, the JVM will provide some from a pool, the heap. Returning memory back to the heap is done by the GC. The GC detects which data (objects) is no longer in use (reachable) and recycles the space occupied by it for reuse.
Garbage collection is usually a quick and reliable cycle, problems arise if the memory demand exceeds the heap size. The most common fault is configuring insufficient heap space (the -Xmx=<size> JVM parameter), sometimes also memory leaks by faulty mod code, a poor choice of JVM parameters or starting the MC server without nogui.
Typical presentation:
- Unusually long startup time up to freezing completely
- Freezes at runtime, especially client side frame drops right before/when the heap use in F3 drops
- CPU load on all cores during freezes
- Heap usage in F3 or
/sampler memory(server) or/csampler memory(client) always close to the upper limit - High GC counts or time ratios in
/sampler memory(server) or/csampler memory(client) - last two rows, both should be well under 30000 "ppm of uptime" several minutes after startup - Crashes with OutOfMemoryError (GC Overhead exceeded etc.)
Note that freezes and memory demand surges may also have other causes, the symptoms are not 100% reliable indicators.
Client side[edit]
Client side issues are problems on the client thread, i.e. the rendering part of game and client ticking mostly for interpolation, not the somewhat hidden server thread that also exists in single player.
Typical presentation:
- Low frame rate (FPS)
- Frame drops - the game doesn't react smoothly to mouse movement
- Sometimes even freezes, often correlating with lots of chunk updates
- Unsteady frame time debug graph (added by Sampler to F3)
- CPU load on no more than two cores
Freezes overlap symptomatically with low memory issues.
Server side[edit]
Anything happening on the dedicated server or the server thread in single player.
Typical presentation:
- Blocks don't break instantly or reappear
- Jittering skybox movement (stars/sun don't move smoothly or jump back in time)
- GUIs (chests etc.) don't open instantly
- "Can't keep up" warnings in the server console/log
- Low average tick rate or tick time spikes (lag spike) as observable through
/sampler tps(avg = average, should be ~50 ms, max = maximum within the last ~2 minutes, should be below 500 ms) - Low or unsteady tick rate observable in F3 (with Sampler installed on both client and server)
Note that Sampler always reports high average and maximum tick times in the first ~2 minutes after startup - the first few ticks are always very slow and bias the statistics. The tick time will routinely go below 50 ms (tick rate over 20) after a lag spike to bring the average rate back in line with the target. The tick rate/time reported by Forge, Minecraft's server GUI or other mods is not reliable!
Network latency (ping) fluctuations, packet loss or generally high network latency causes similar response delays as an overloaded server. Looking at the tick times helps to differentiate between server performance and network problems.
Frame time debug graph[edit]
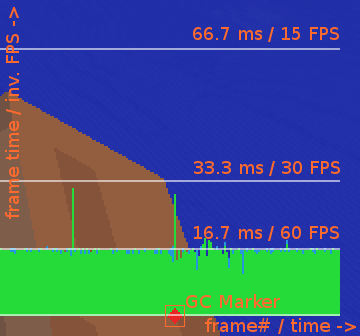
Sampler adds a graph to the debug overlay (F3 ingame) for how much time the game spent in each of the last ~2k frames. The output is unfiltered and shows whether the game runs smoothly (low continuous line), slowly (high continuous line) or with stuttering/"frame drops" (non-continuous with peaks).
The horizontal (x) axis spans all recorded frames with the oldest frame on the left and the last frame on the right. The vertical (y) axis is the frame time, i.e. how long it took to process the specific frame. Inverting the frame time yields the frame rate (FPS = 1/frame_time). As the graph shows the frame time, lower is better/faster.
Four horizontal white lines indicate the important frame times, the baseline at the bottom for 0 ms (infinite FPS), 1/60 = 16.67 ms (60 FPS) above, then 1/30 = 33.33 ms (30 FPS) and finally 1/15 = 66.67 ms (15 FPS) at the top. Anything slower will exceed the area, maintaining the linear scale.
The graph itself uses two colors, blue for time spent in the client tick (simulating) and green for the remainder (rendering, vsync, misc).
New Sampler versions add red rhomb shaped GC markers to the bottom of the graph. They show whenever Sampler detected a garbage collection run, making it easy to spot whether a frame time spike was caused by GC.
Using VisualVM[edit]
VisualVM can be used to look at the nps files produced by Sampler's export and trigger commands. To open a nps file in VisualVM select File - Load from its menu, change the filter to "Profiler Snapshots", then select the desired file.
The basics[edit]
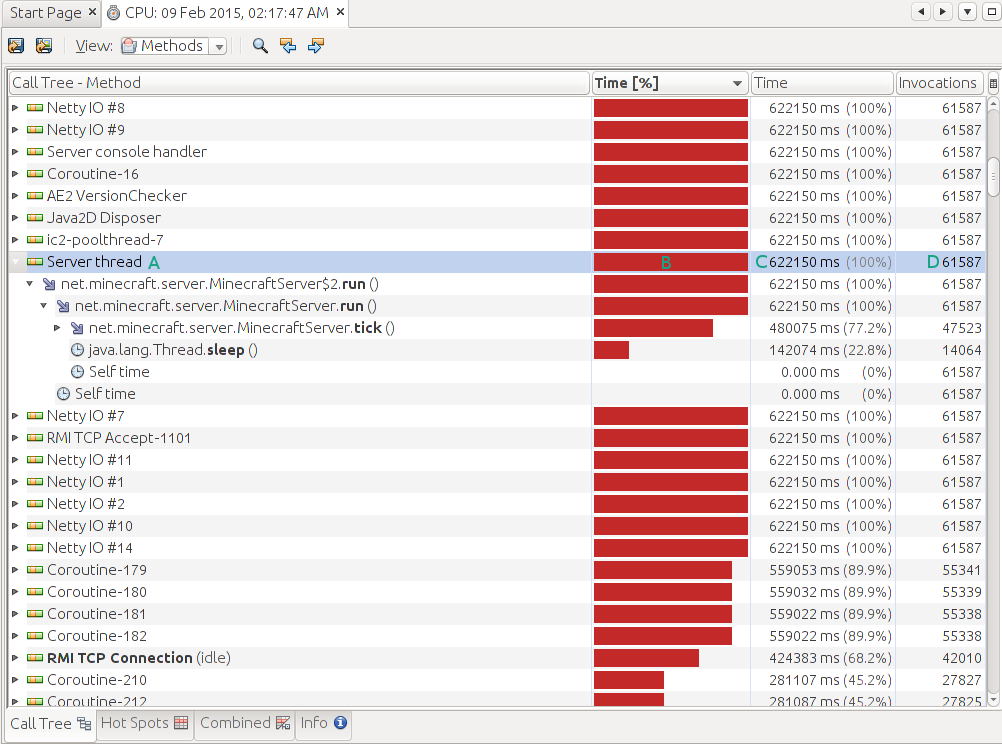
The following screenshot shows how VisualVM displays the results:
On the top the tab named "CPU: ..." represents the specific nps file, there's one for each opened file. The "Call Tree", "Hot Spots", ... tabs select different views of the data, only "Call Tree" is of interest. "Hot Spots" may seem interesting, but is generally misleading and better to be ignored.
Analysis should always start with the following steps:
- Search the "Server thread" (A) or "Client thread" entry, depending on what is to be analyzed. Server thread = "/sampler", Client thread = "/csampler".
- Check if the value in the Time column (C) corresponds to the value in the Invocations column (D). With Sampler's default settings, the time should be roughly 10 ms for every invocation. In this case 61587 invocations * 10 ms = 615870 ms, which is close enough to 622150 ms. If the numbers are far off, this means that the Java Virtual Machine didn't execute code all the time - usually because it was garbage collecting - and the profile data is worthless. Use different methods like looking at "/(c)sampler memory" then.
- Unfold Server/Client thread to see where time is being spent
The red bar (B) shows how much of the time was spent in the current entry (row) and its children. This is a top-down view that gradually fans out into the different areas of the program, starting with Server/Client thread, going into the game loop, then dividing into doing actual work and sleeping/waiting for the next simulation step. The actual work splits further into ticking blocks, entities, loading chunks etc.
Every entry refers to either a method or "Self time". A method entry is for time spent in the named method invoked by the parent, self time by the parent itself. In the example MinecraftServer.run spends 77.2% in MinecraftServer.tick, 22.8% in Thread.sleep and 0% in itself. A substantial Thread.sleep time means that the thread is partially idle and has spare CPU time, which is optimal.
Investigation in the example scenario would continue by unfolding MinecraftServer.tick a couple times, noticing that eventually 42% go towards entity simulation and 20% towards block ticks with nothing below sticking out too much. Without severe outliers that could be targeted specifically, like by removing a problematic tile entity, broad problem categories can still be helped through generic administrative measures. Block ticks and entities both depend on the number of loaded chunks, managing chunk loading, reducing the view distance and restarting the server all reduce the loaded chunk count. Entities can be culled by limiting mob farm use and searching for rogue setups like out of control mob spawners.
Identifying a locatable problem like too much load from net.minecraft.entity.EntityLiving can be followed up by finding the responsible game objects using the "/(c)sampler find" command, e.g. "/sampler find net.minecraft.entity.EntityLiving --chunkCounts" to retrieve a quantity-ordered list of all chunks containing EntityLiving instances.
Note that the method names are usually obfuscated in Minecraft, e.g. "tick" may get replaced with "func_someNumber", but it is still possible to see the class name. Those names can be translated by MCPBot or by looking at the methods.csv file that comes with a Forge development environment.

